

Where Did All The Workers Go?
These patterns are repeating across the high-income developed world – Germany, the UK, Japan, South Korea, Australia.
By Bret Swanson | Guest Writer
In a November 30, 2022, speech on “Inflation and the Labour Market,” Federal Reserve chairman Jerome Powell blamed most of the 3.5 million estimated shortfall in the US labour force on premature retirements. He also blamed a large portion – between 280,000 and 680,000 – on “long COVID.” In a footnote, however, Powell acknowledged a far more somber factor: an estimated 400,000 unexpected deaths among working age people.
It’s easy to blame these deaths on Covid-19. The virus is of course one significant cause. But it’s not nearly the only cause, especially among young and middle-age workers. We need better government data transparency to make a full assessment. Until then, we can proceed with others who track mortality for a living – life insurance companies.
The Great Divide – 2020 vs. 2021
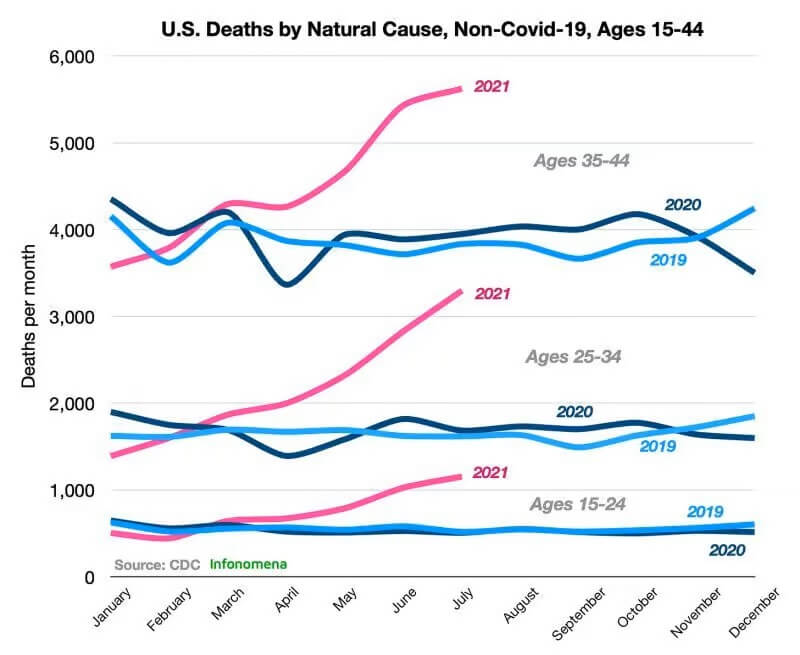
In 2020, Covid-19 took many lives, even among select groups of middle-age people, specifically those with comorbidities such as diabetes. In 2020, COVID did not take very many lives of healthy young and middle-age people – for example, the types of people who are employed at large and mid-size companies and who have group life insurance. As you can see in the chart below, group life insurance benefit payments in 2020 were barely higher than in 2018.
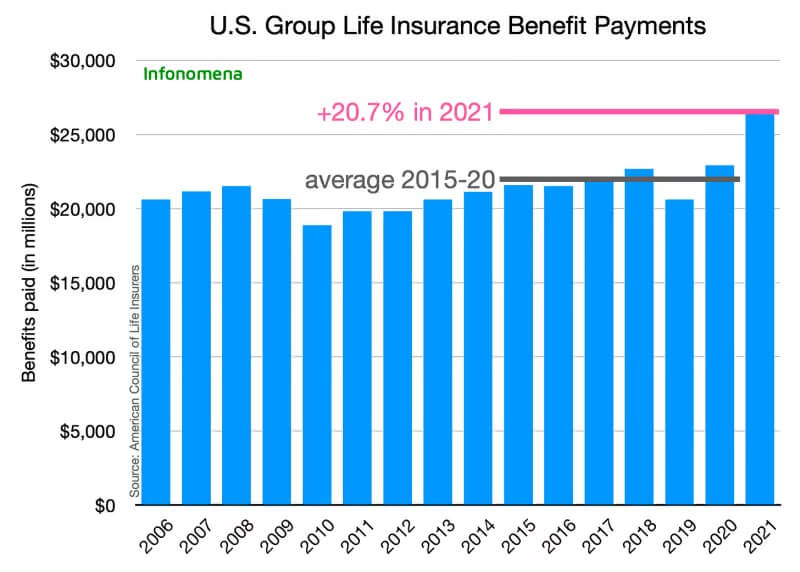
In 2021, however, group life payments exploded by 20.7% over the five year average and by 15% over the acute pandemic year of 2020. Why would healthy young and middle-age people suddenly begin dying in large numbers in 2021 when they’d navigated 2020 with relative success?
Especially when we consider that in 2021, the US administered 520 million Covid-19 vaccine doses. Shouldn’t healthy people employed in good jobs with good benefits, now protected with vaccines, have fared better in 2021 than in 2020? Surely, overdoses and suicides have risen in recent years. But those causes of death are less prominent among the group life cohorts in general, and the latest data confirm these were not drivers of the group life surge. Curiously, two of the largest spikes in 2021 came from deadly automobile accidents and non-automobile accidents.
Millennial Mortality
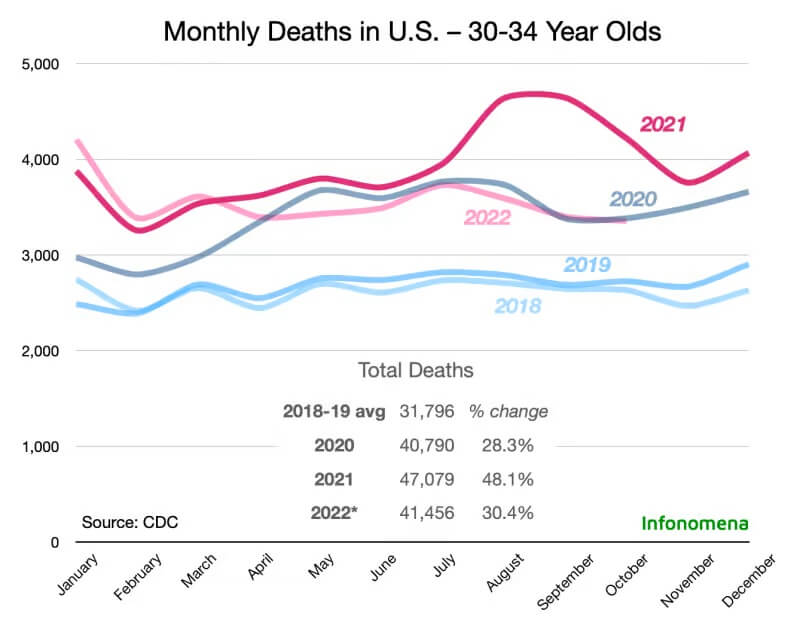
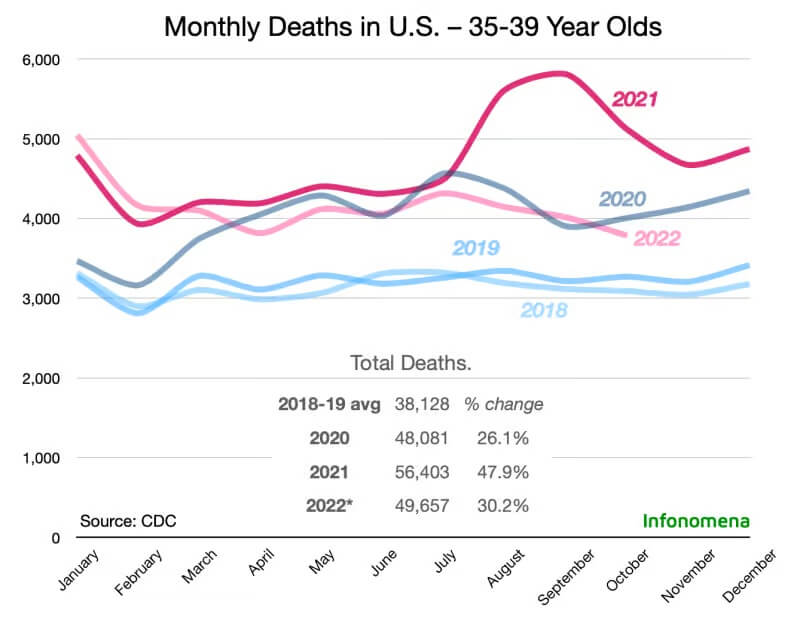
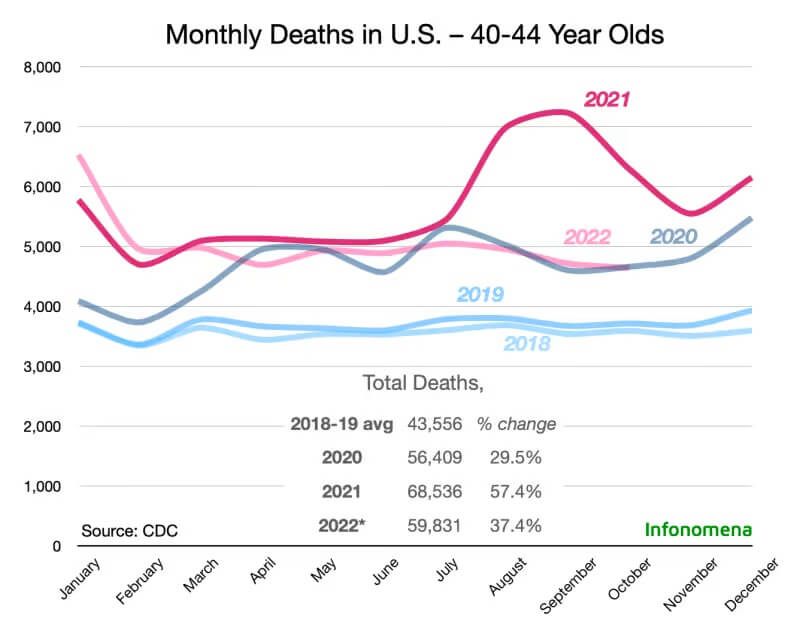
Let’s look at a few of these young adult age groups in more detail. In the charts below, we’ve broken out total all-cause deaths into three groups – 30-34, 35-39, and 40-44. Eyeballing the age group charts alone shows that factors other than Covid-19 itself must have driven large portions of the mortality spike in young and middle-age workers. (We are using official statistics, which likely overstate COVID mortality and understate Non-COVID mortality. It’s the best we’ve got for now.)
- The most important overall point is that 2021 was far worse for young and middle-age people than 2020.
- Another key point is that 2022 was also worse than 2020, though not as bad as 2021.
- Mortality rates in 2022 were still dramatically higher than the pre-pandemic baseline.
Covid-19 hit hard in 2020, especially for the old, vulnerable, and comorbid. In other words, Covid-19 took many of the unhealthiest from us in 2020. In principle, therefore, a smaller number unhealthy people might have been susceptible to Covid-19 in 2021 and 2022. High mortality years are often followed by low mortality years. After two successive high mortality years, the third year is even more likely to be low-mortality. For 2022 to be as bad, or somewhat worse, than 2020, is thus a big surprise. Last year’s milder Omicron variants make 2022’s stubbornly high mortality rate even more baffling.
All-cause mortality is crucial to understand whether public health policies are working. All-cause numbers can also help expose faulty reasoning when overly narrow, overly complicated, or overly clever analyses miss or hide important signals. For example, an analysis which purported to show lockdowns reduced COVID deaths but which neglected to show other deaths rose even more, would not reflect the totality of the policy’s effects. Likewise, a chemotherapy which shrinks tumours but kills patients may be successful in its narrow task yet fail the larger mission. Most analysts and health authorities studiously ignored all-cause over the last three years. The all-cause figures above show our COVID policies were far from successful.
For other purposes, however, it’s helpful and even necessary to drill down on specific causes. Important signals can also be lost in large groupings – Simpson’s paradox, for example, is a common statistical illusion. (Few have dug deeper, with as much specificity, as John Beaudoin, an engineer from Massachusetts who gained access to his state’s digital death records for the last eight years. He shows that specific causes of death spike and fall at important moments and periods. CDC data is not organized with such granularity. More on Beaudoin’s analysis in coming weeks…)
We know that recent years saw an upswing in drug overdoses and suicides, which accelerated with the pandemic lockdowns. Although these troubling trends cannot explain the enormous and unprecedented all-cause mortality seen above, we should attempt to account for them. Likewise, although Covid-19 did not cause all these record deaths, it was a significant factor.
Employment Aberration
So we dig deeper. If we remove both Covid-19 and unnatural deaths (homicide, suicide, overdose, etc.), we see a dramatic spike of natural, non-Covid-19 deaths among working age people beginning in the spring and summer of 2021. The CDC then stopped publishing the detailed data breaking out these particular categories.
But we know this trend continued. In fact, it got much worse. The life insurance companies told us so. On a December 30, 2021, videoconference with the Indiana Chamber of Commerce, OneAmerica CEO Scott Davison reported with shock:
“And what we saw just in third quarter, we’re seeing it continue into fourth quarter, is that death rates are up 40% over what they were pre-pandemic.”
“40% is just unheard of.”
“It may not all be COVID on their death certificate, but deaths are up just huge, huge numbers.”
Several months later, Lincoln National reported its 2021 payouts were $1.4 billion, versus $548 million in 2020, a 164% rise.
As you will remember seeing in our three all-cause charts, August, September, and October of 2021 showed a gigantic upward bubble – the worst ever period of concentrated young and middle-age deaths, at least in modern times.
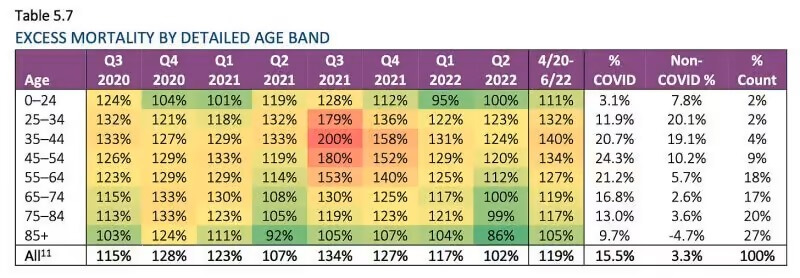
Heart attacks, strokes, pulmonary embolisms, accidents, and many seemingly-inexplicable sudden deaths, which continued into 2022, and now in 2023. Here is the Society of Actuaries November 2022 update, which goes through June 2022.
It’s true that the late summer and fall period of 2021 coincided with the Delta wave in the US, which was more infectious and appeared to be more pathogenic than previous variants. (We’ve suggested the mass vaccination programs may have, by exerting extreme evolutionary pressure, driven convergence onto more infectious, vaccine-evading variants. Brand new research just published in the New England Journal of Medicine continues to bolster our escape variant thesis: Substantial Neutralization Escape by SARS-CoV-2 Omicron Variants BQ.1.1 and XBB.1.)
Federal officials and the medical establishment, you will recall, argued in 2021 that it was a “pandemic of the unvaccinated.” Even the Society of Actuaries attempts to explain away its alarming findings by implying the deaths are due to lack of vaccination. It does so with crude regressions of excess mortality and bulk state-wide vaccination totals as of June 30, 2021.
But remember those 520 million vaccine doses. How can you generate far more deaths in 2021 – ascribing them to unvaccination – with a dramatically smaller number of unvaccinated people? In 2021, perhaps 20-40% of these group life insureds were unvaccinated. In 2020, 100% of them were unvaccinated, yet mortality barely rose. The math doesn’t come close to working.
The 40-44 age group, for example, suffered 21.5% more total deaths in 2021 than 2020. This terrible outcome occurred with less than half the so-called susceptible population due to their unvaccinated status. It’s difficult to assert robust vaccine effectiveness when both doses-delivered and deaths are skyrocketing.
On the other hand, the group life insurance data show vaccinated groups may have suffered the worse outcomes. By August, most large and mid-size companies and organizations across the country had vaccine mandates, and most employees complied. Yet these workers suffered extraordinary – indeed, totally unprecedented death rates – in 2021, especially the second half of 2021.

Ed Dowd, a former BlackRock portfolio manager, points to a crucial peculiarity in his book Cause Unknown. Employed people with group life insurance policies are far healthier than their overall population cohort. They typically die at a significantly lower rate, just 30-40% of the overall population. This is an iron actuarial law. In 2021, however, as you can see in the chart directly above, these employed Americans died at excess rates far higher than their larger pool of less healthy peers.
We could also point to fast-rising disability as a key factor in the worker shortage. Fed chair Powell blames it on long COVID. Once again, however, the timing doesn’t fit that story very well.
To overgeneralize:
In 2020, the vulnerable died of COVID at unusually high rates. In 2021 and 2022, COVID continued its assault, but the young, middle-aged, and healthy also died in aberrantly high numbers of something else.
These patterns are repeating across the high-income developed world – Germany, the UK, Japan, South Korea, Australia.
Views expressed in this article are the opinions of the author and do not necessarily reflect the views of Collective Spark.
* * *
About the Author
Bret Swanson is president of the technology research firm Entropy Economics LLC, a non-resident senior fellow at the American Enterprise Institute, and writes the Infonomena Substack.
* * *
READ MORE: Michael Snyder: The Overall Theme For 2023 Will Be “Here We Go!”
Read more on Hot News: Something Really Strange Is Happening…
Liked it? Take a second to support Collective Spark.
We’d love to hear from you! If you have a comment about this article or if you have a tip for a future Collective Spark Story please let us know below in the comment section.